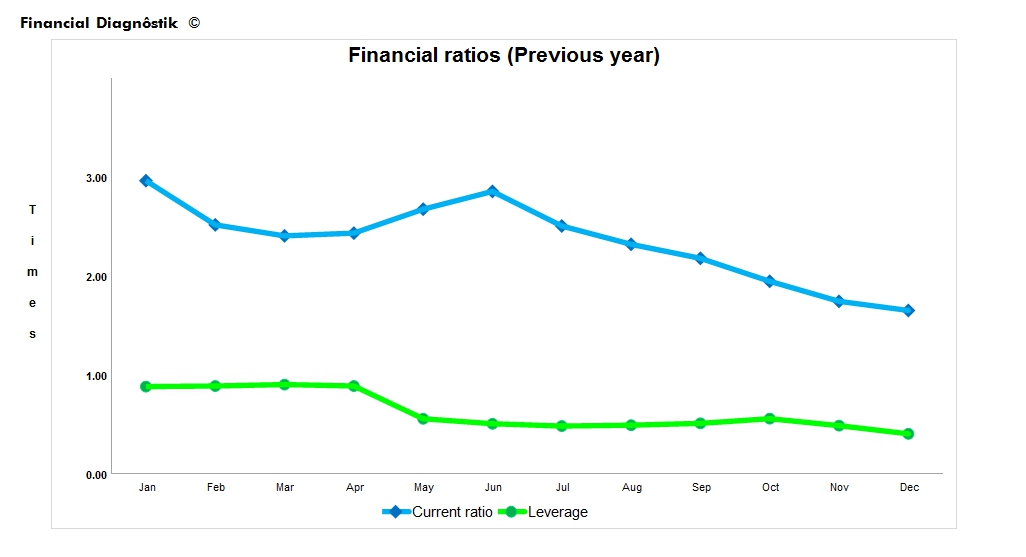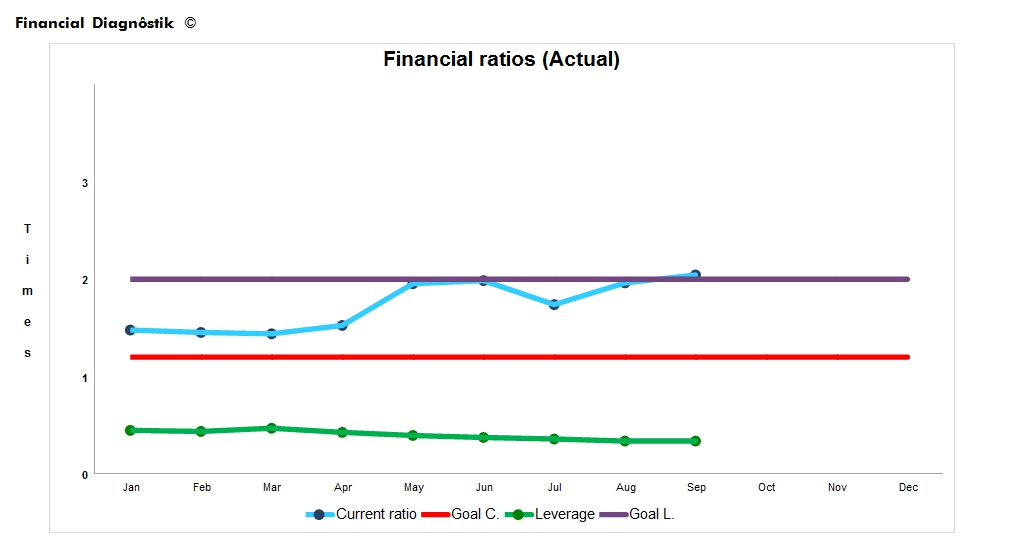

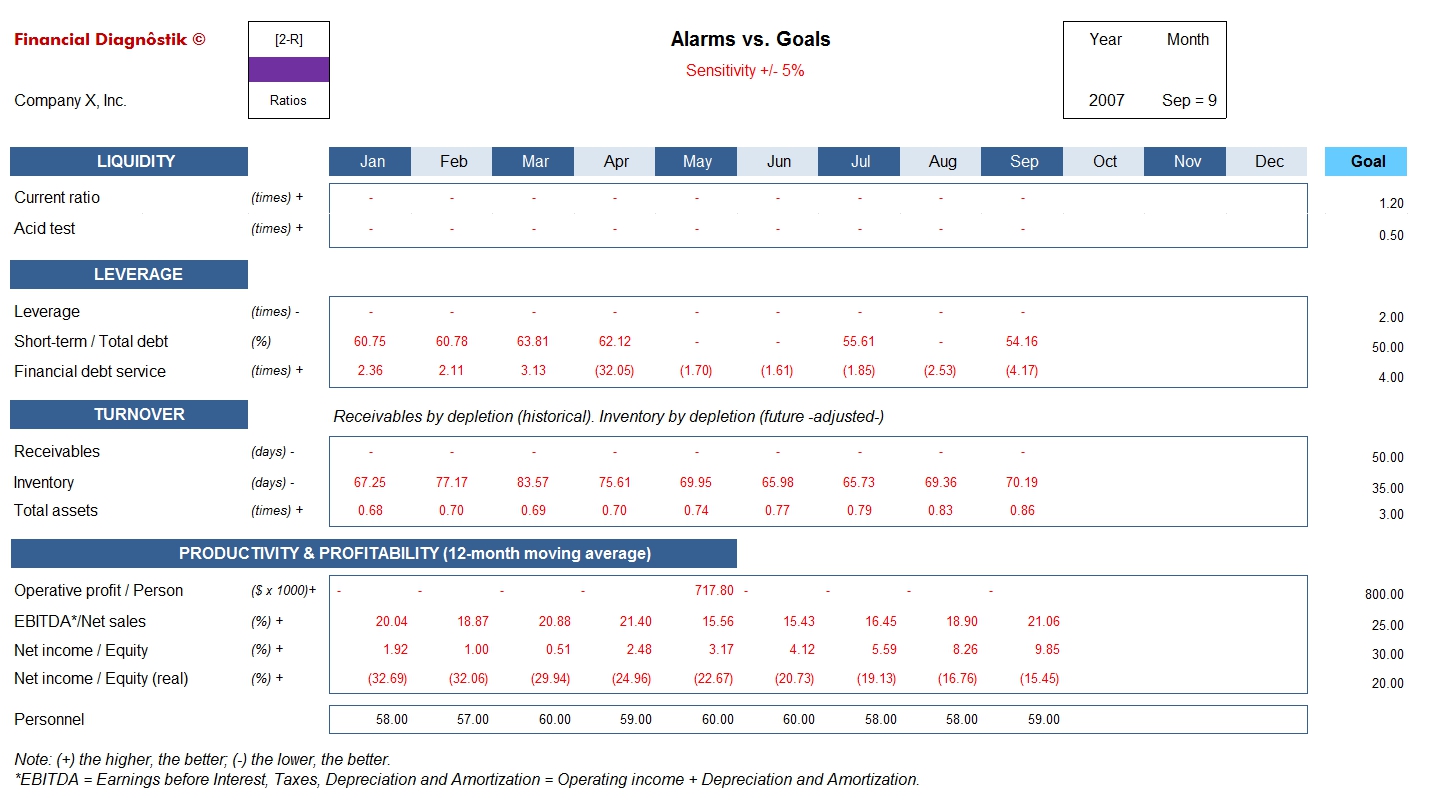
[2-R] Financial ratios and alarms overview vs. goals
Financial Diagnôstik © provides the twelve most important financial ratios in two scenarios, the first one being the result of the calculation about the historical information and the second one (shown in report [2-R]) presents every unfavourable variation to the goal, according to the chosen sensibility. This helps enormously to recognise in which months the goal was not met and eases for the analist of the company the arising of suggestions.
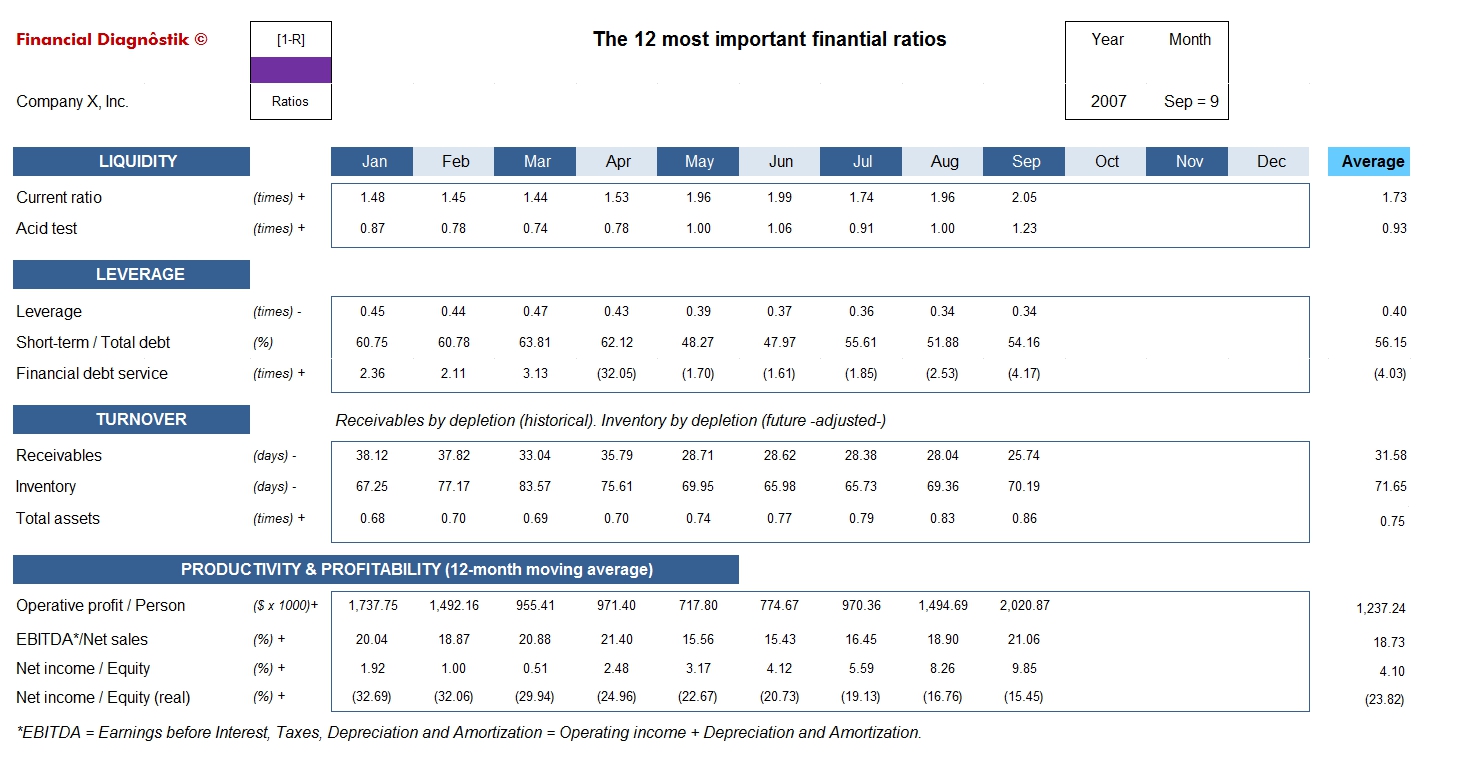
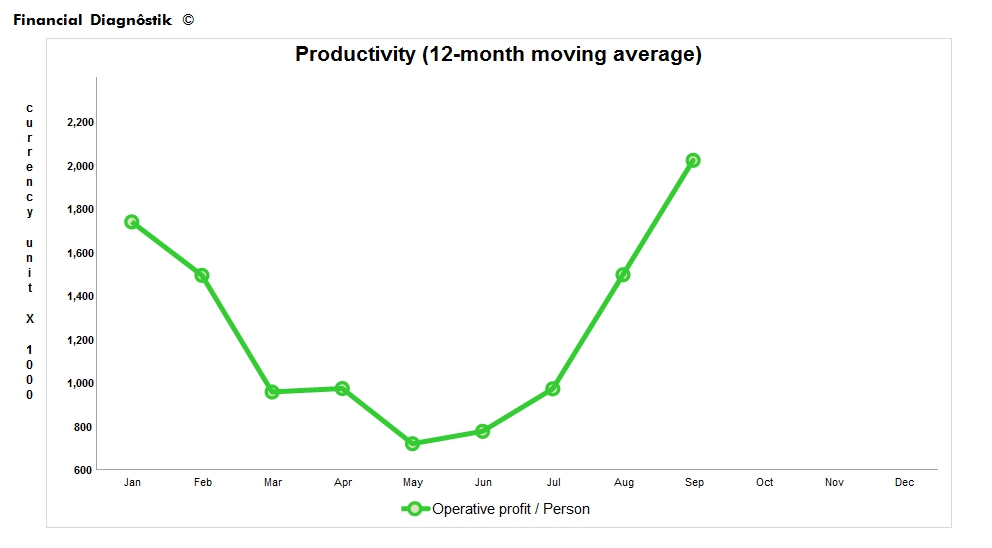
It provides additional information of the Total Personnel that worked for the company in each month, with which we can take decisions about one of the most important rows in the Operating expenses.
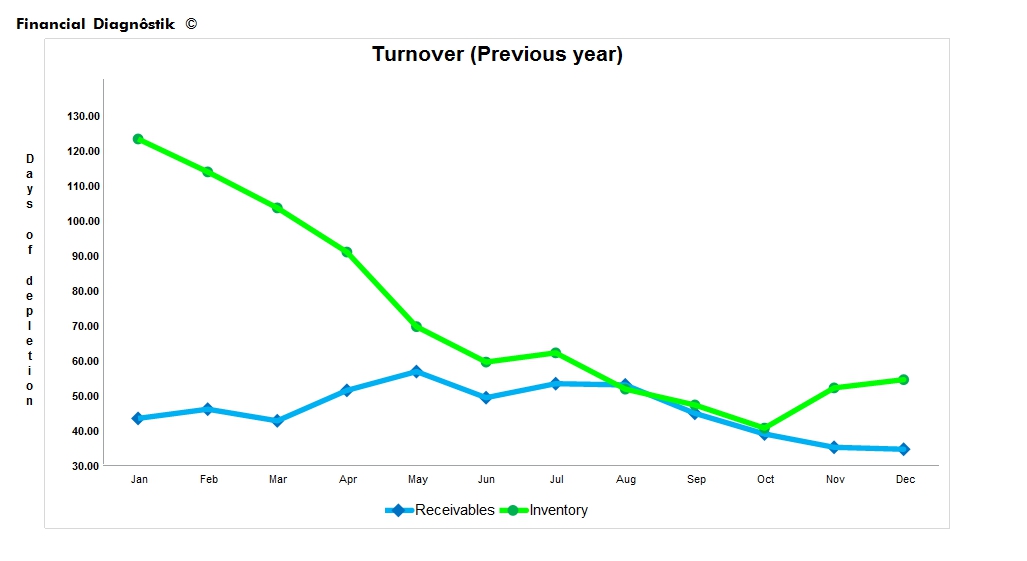
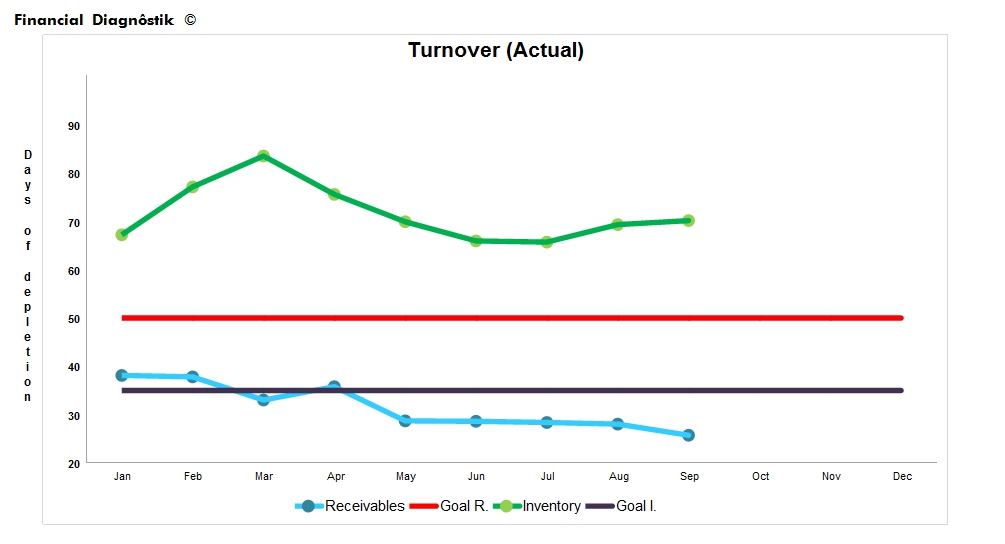
Note that between the tables there is either a positive or negative sign with the objective of easing the analist's work; if the sign is positive, then the data to the right must be increasing so that the results are favourable; if it's negative, they should decrease. Example: the Acid test has a positive sign (+): if the numbers to the right increase, the position is better. In another example: the Receivables turnover has a negative sign, if the receivable days keep decreasing, it's better for the company.
The Total assets turnover must be greater, because this establishes how well the Total assets are being used; it's better to sell more with less assets. Our example shows an average of (0.7) way below our expected goal of (3.0), as it can be seen in the report [2-R].