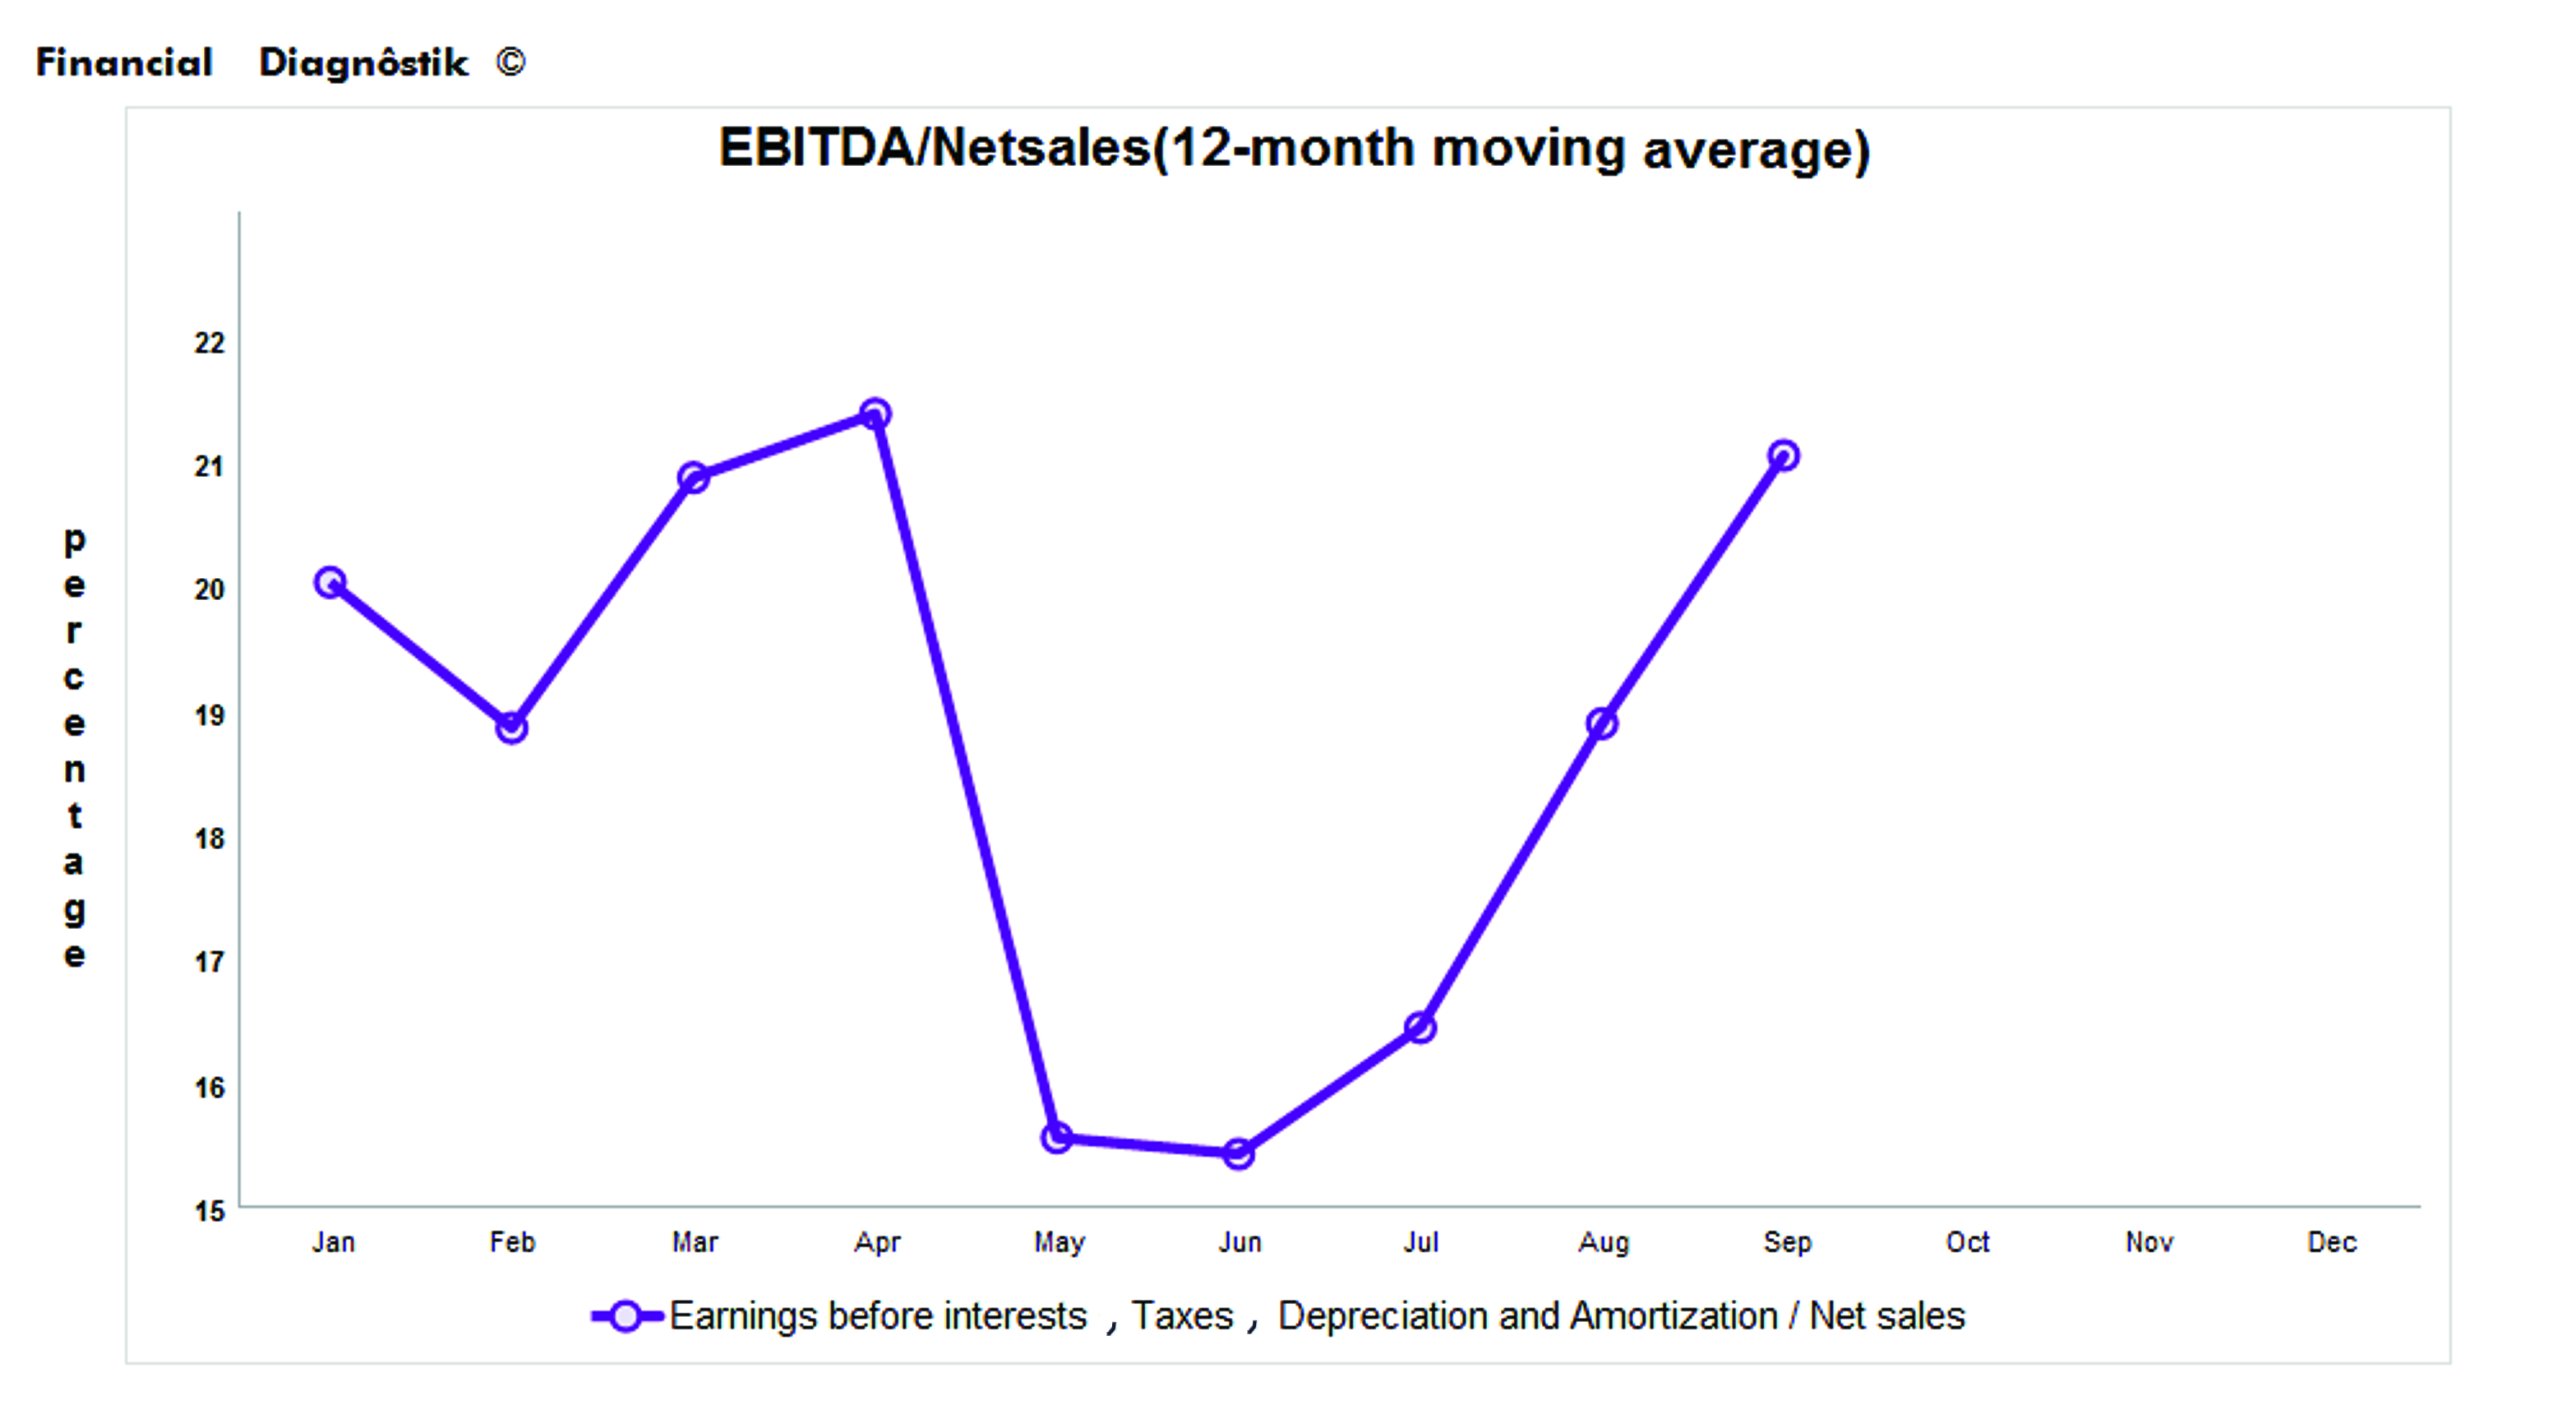
Graph [R-6] Ebitda / Sales — 12-month moving average — Financial ratios Operating income + Depreciation + Amortization-----------------------------------------------------------Net sales