
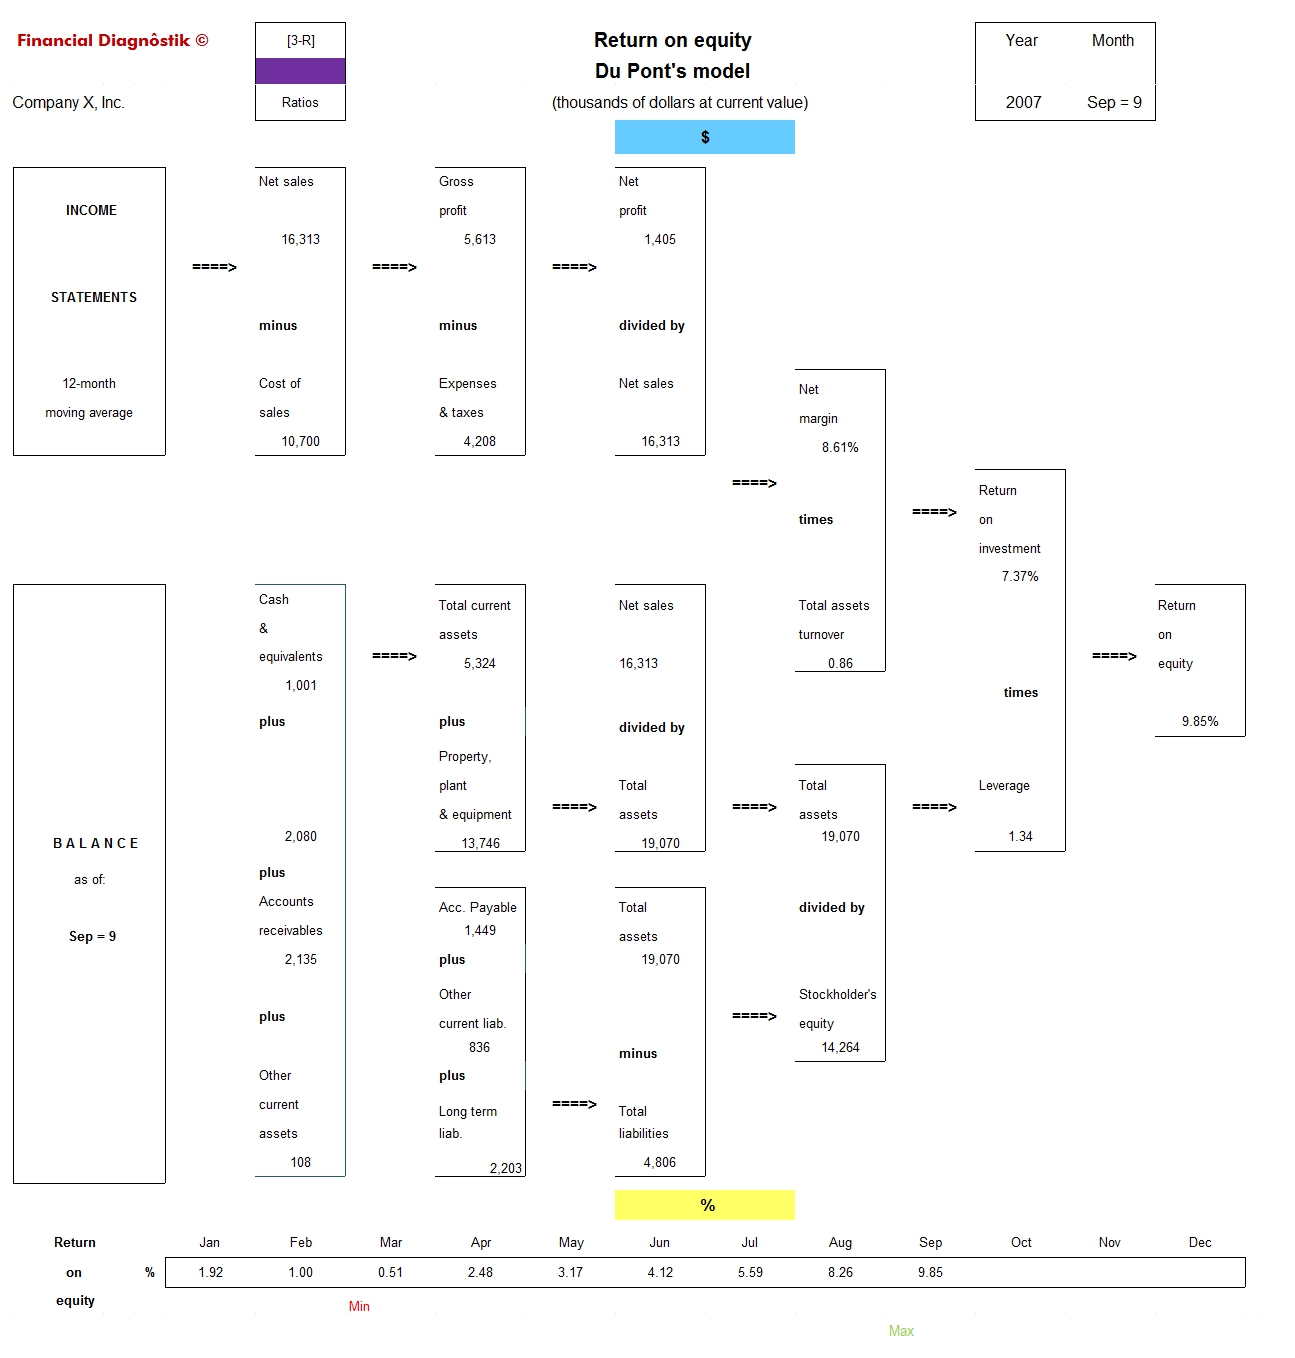
[3-R] Return on equity, Du Pont Model
— Currency unit at current value —
This report, which was originally used by the company Du Pont in the United States and that has been restructured for a better visualization of the administrative-accounting process, combines the Income statement with the Balance sheet to show graphically the structure of the company.
Nowadays, the directors have to take a ton of decisions that affect every single phase of the business.
Think of the movements made by the threads of a puppet. The result of this is the Return on equity and if it increases from one month to the other, the result is better. Added to this, it shows step by step and objectively the accounting process.
The Du Pont model, presented in the way Financial Diagnôstik © does, turns out to be an incalculable aid to define the corrective measures that allow the improvement of the Return on equity, for if we analyze from right to left, we will find clearly the elements that we need to make better in function of the calculation of multiplication and division that must be done to get each result.
For example, if we wish to improve the Return on equity and this is the result of the multiplication of the Return on assets by the Leverage ratio, our option is to elevate our Return on assets or increase the Leverage ratio, and this method of analysis applies to the rest of the concepts. In the inferior part of the report the Return on equity is shown panoramically as well as the months with Maximum=Max and Minimum=Min return.