
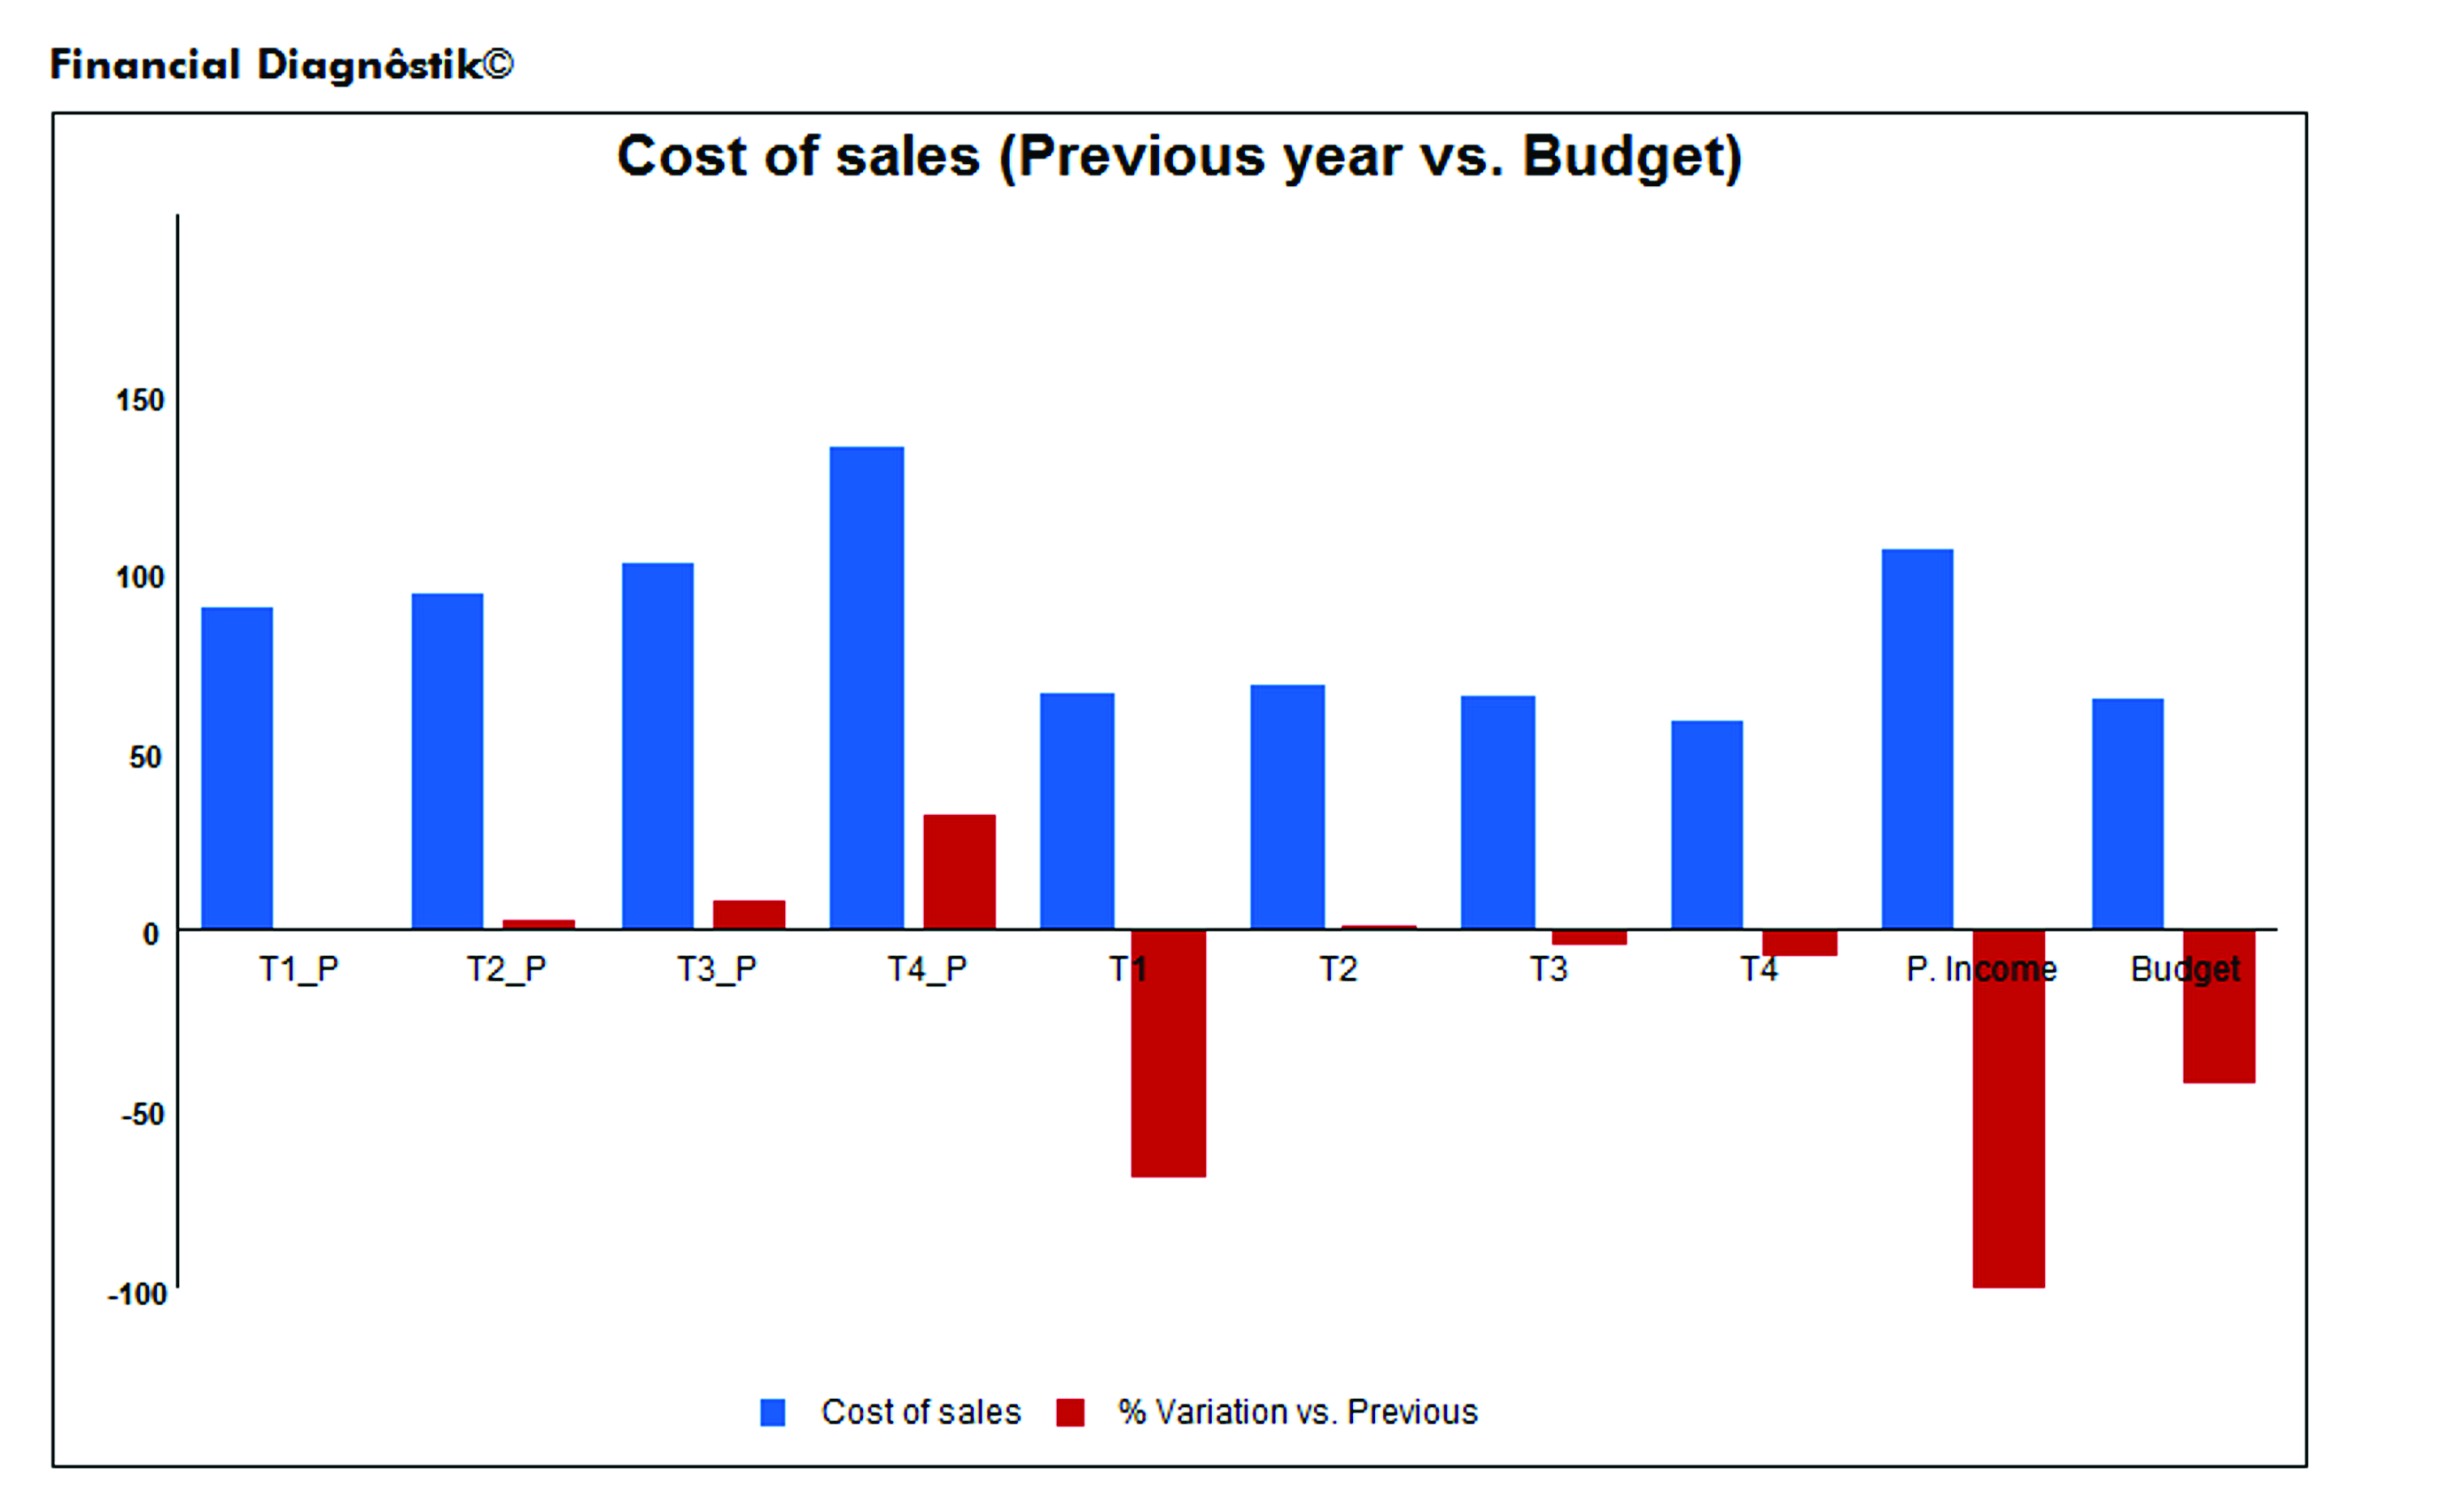
Graph [F-2] Cost of sales
Previous year income statement vs. Budget of current year
In this graph, the Cost of sales is displayed in percentage of sales of the previous year compared to the budget.
The last bars show the annual percentages from the budget (65%) as well as the previous year (63%) and the difference between them, with its quarterly variations.
The graphic of our example shows that the budgeted cost of sales is 2% higher than the previous year.